A new year has begun, new plans for the next holidays were made….I take a look at the calendar and funny questions come into my mind :
“When a child is born on easter sunday 2017 , how long does the child has to wait until it can
celebrate its birthday party on easter sunday again ?”
After digging into this I realized that I can explore some of the stl algorithms and do some basic statistical analysis.
when it is easter ?
The definition is : “Easter would fall after the first full moon following the vernal or spring equinox. (The equinox is a day in the year on which daytime and night-time are of equal length. This happens twice a year, once in spring and once in autumn.)
It turns out that the earliest possble date is March 22th and the latest posible date is the April the 25th. Despite this definiton is quite clear one can not put it directly into code.
In 1800 C. F. Gauss [1] developed a formula that returns the easter (sun)day for a given year.
In the following I will use a modified version of the easter formula after which was introduced by Lichtenberg [2]. You can find the source code here ([3])
For example:
int eDay = getEasterDay(2017); |
returns 47, which means the “47th of March”, which is in fact the 47 – 31 = 16th of April.
easter data
For a given esterday we calcluate a list of years and we store this distribution into a std::map. The range of years is choosen from the year 1582 to the year 2582.
std::map<int,std::vector<int> > edayDistribution; for(int e = 22 ; e < 57; ++e) { eDayDistribution[e] = getListOfYears(e,1582,2582); } |
The function getListOfYears loops over the range of years and compares against the given easter day like this:
std::vector<int> getListOfYears(int easter_day,int start_year , int end_year ) { std::vector listOfYears; for(int year= start_year ; y < end_year; ++y) { if( easter_day == getEasterDay(year)) { ret.push_back(year); } } return (listOfYears); } |
easter day repeat interval
This allows us to answer the question from the introduction like this:
std::vector<int> list_16th_of_April = eDayDistribution[47]; auto pos_of_2017 = std::find(list_16th_of_April.begin(), list_16th_of_April.end(), 2017); int result = (*(pos_of_2017+1) - *pos_of_2017); |
In this case it takes 11 years from 2017 on to meet easter sunday on the 16th of April again.
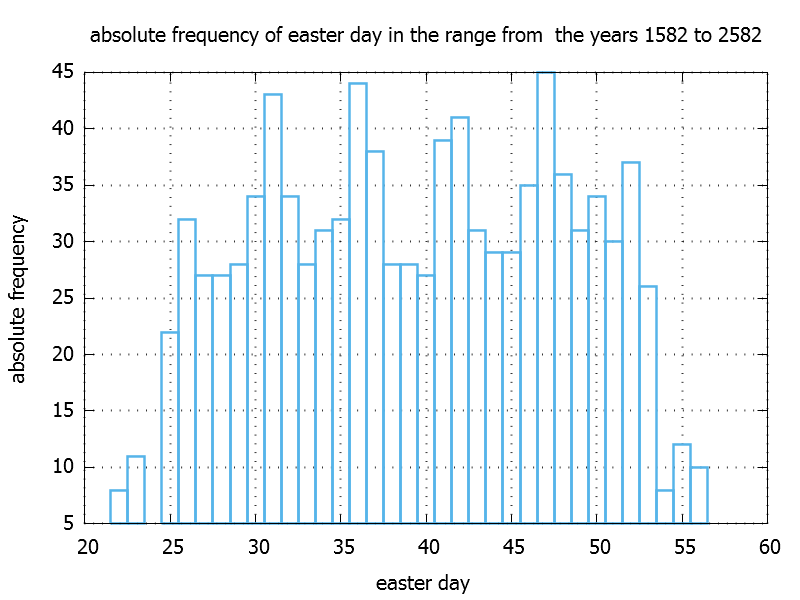
From that data base we can also plot the absolute frequency of the easter day, by simply draw the size of the vector ( eDayDistribution[e].size() ) against e.
std::adjacent_difference
The easter day repeat interval in the previous example is the difference of adjacent elements. To do it on the entire vector the stl provides us an algorithm called std::adjacent_difference.
Because this algorithm changes the elements in the vector we make a copy of the map first by using the assignment operator and than apply the algorithm for each vector in our map:
std::map<int, std::vector<int> > eDayDiffDistribution = eDayDistribution; for(size_t e = 22 ; e < 57; ++e) { std::adjacent_difference(eDayDiffDistribution[e].begin(), eDayDiffDistribution[e].end(), eDayDiffDistribution[e].begin()); } |
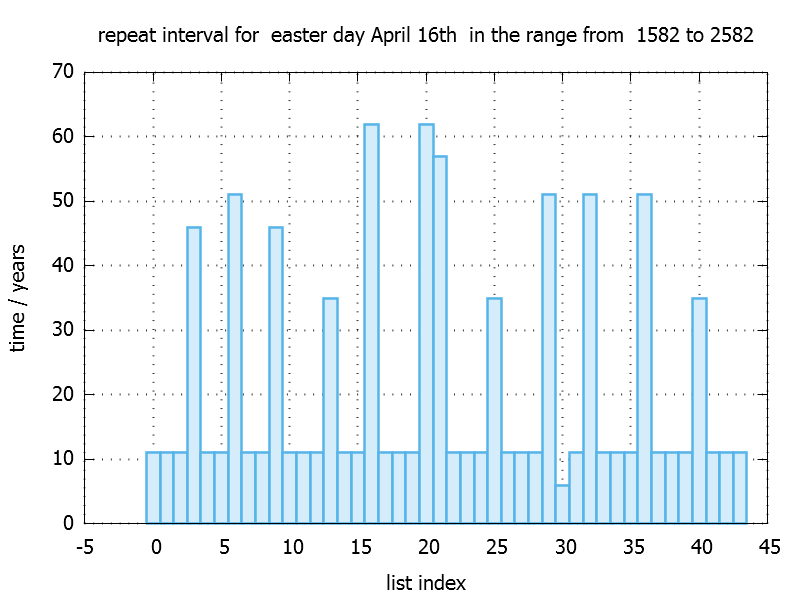
The first element of the resulting vector remains the unchanged value, because we can get only eDayDistribution[e].size()-1 differences. As a side effect we can reconstruct the original vector by adding up all the differences if needed.
For April 16th it looks like this:
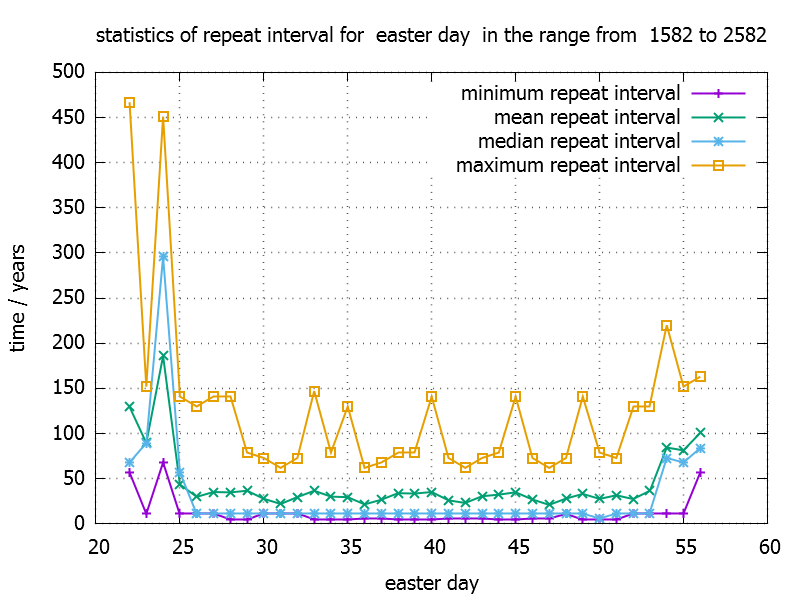
statistical data
min, max
So what are the minimum and maximum number of years we have to wait ? So let us use stl min_element and max_element.
Note that we must skip the first element of the vector, because it does not contain a difference. These algorithms return an iterator pointing to min or max and by dereferncing the iterator we get the value.
auto min = std::min_element(eDayDiffDistribution[e].begin()+1, eDayDiffDistribution[e].end()); auto max = std::max_element(eDayDiffDistribution[e].begin()+1, eDayDiffDistribution[e].end()); |
mean
How long to wait on average ? So the work of looping over the elements and calculate the sum is taken over by std::accumulate.
int numberOfData = eDayDiffDistribution[e].size()-1; auto sum = std::accumulate(eDayDiffDistribution[e].begin()+1, eDayDiffDistribution[e].end(), 0.0); double mean= sum/ numberOfData; |
The third argument to accumulate is the start value of the sum.
standard deviation
std::accumulate uses a default computation kernel : a = a + b with 0.0 as initial value of the sum. An overloaded std::accumulate takes abinary operation function object that will be applied. With the help of a lambda we can rewrite like this:
auto sum = std::accumulate(eDayDiffDistribution[e].begin()+1, eDayDiffDistribution[e].end(), 0.0, [](int a, int b) { return (a+b); } ); |
The standard deviation of a distribution [4] is proportional to the sum of the squared difference between the mean value and a data value. So we only have to rewrite the lambda function to compute the standard deviation. Note that we catch the previously calculated mean value.
double sum_diff_squared = std::accumulate(eDayDiffDistribution[e].begin()+1, eDayDiffDistribution[e].end(), 0.0, [mean](int a, int b) { return (a + pow((b-mean),2.0) ); } ); double std_dev = sqrt( sum_diff_squared/(numberOfData -1)); |
The same applies for other statistical momentums based on the mean value like skewness:
// define a lambda function for "skewness": auto diffCubicOp = [&mean](int a,int b) { return( a + pow((b-average),3.0) ); }; double sum_diff_cubic = std::accumulate(eDayDiffDistribution[e].begin+1,eDayDiffDistribution[e].end(),0.0,diffCubicOp); double skewness =sum_diff_cubic/((numberOfData-1)*pow(std_dev,3)); |
median
Sometimes one prefers the median over the mean value of a distibution for stability reasons. For example “outliers” are not taken into account that much. To calculate the median we have to sort the list of data and than take the value which is in the middle of the sorted list. If the list contains an even number of data points we take the average of the two values left and right of the “middle”. By knowing this it sounds straight forward to use std::sort. But it turns out that it is not neccessary to sort the entire container completly. It would fit if the elements left of the middle element are less and the elements right from the middle are greater than the middle element. For that purpose we can use std::nth_element, which does the described partial sort. We only have to specifiy the nth element as our middle elememt. If the size of the container is odd, we need only one call to std::nth_element . Otherwise we run a second time with (n+1)th element and average the two values.
template<class T,class Iter> double median(const Iter begin, const Iter end) { T tmp(begin,end); std::nth_element(tmp.begin(), tmp.begin()+tmp.size()/2, tmp.end()); double ret = tmp[tmp.size()/2]; if(tmp.size() % 2 == 0 ) // second pass and average { std::nth_element(tmp.begin(), (tmp.begin()+tmp.size()/2)+1, tmp.end()); ret =( ret + tmp[ (tmp.size()/2)+1 ] )/2.0; } return ret; } |
summary
references / further reading
[1] https://en.wikipedia.org/wiki/Easter
[2] H.Lichtenberg: “Zur Interpretation der Gauß’schen Osterformel und ihrer Ausnahmeregeln”, Historia Mathematica 24 (1997), S.441-44
[3] https://github.com/vlovo/easterStats
[4] https://en.wikipedia.org/wiki/Standard_deviation